Areas at Risk of Flooding in Historic New Castle
| Recent Storms | LIDAR Elevation | DNREC Inundation | FEMA Floodplain | Dike Profiles |
Dikes north and south of New Castle were damaged during Hurricane Sandy in October 2012 and an unnamed storm on December 21. The latter had just the combination of wind, rain and tide to cause almost as much flooding as the hurricane. With two storms in close succession, residents wondered:
What areas are at risk of flooding if current dikes fail?
What areas would flood with water 1 or 2 feet higher than in the recent storms?
Where are new dikes needed to protect homes in the both the historic district and other parts of town?
A wide variety of information is available on the web, but the differing
vertical reference points cause confusion.
There are DNREC inundation maps with elevations referenced to MHHW (Mean Higher High Water),
proposed and actual dike elevations referenced to MSL (Mean Sea Level)
using two zero points which differ by 0.88 feet (NADV88 and NGVD29, respectively) and
FEMA flood maps with two different zero points: 2011 vs NGVD29 and 2013 vs NADV88.
It's confusing! To make it clearer, this page shows elevations flooded in the recent storms, and what areas would be flooded at one or two or four
feet greater height of water.
Recent Storms
 Hurricane Sandy |
 Pre-Christmas storm
|
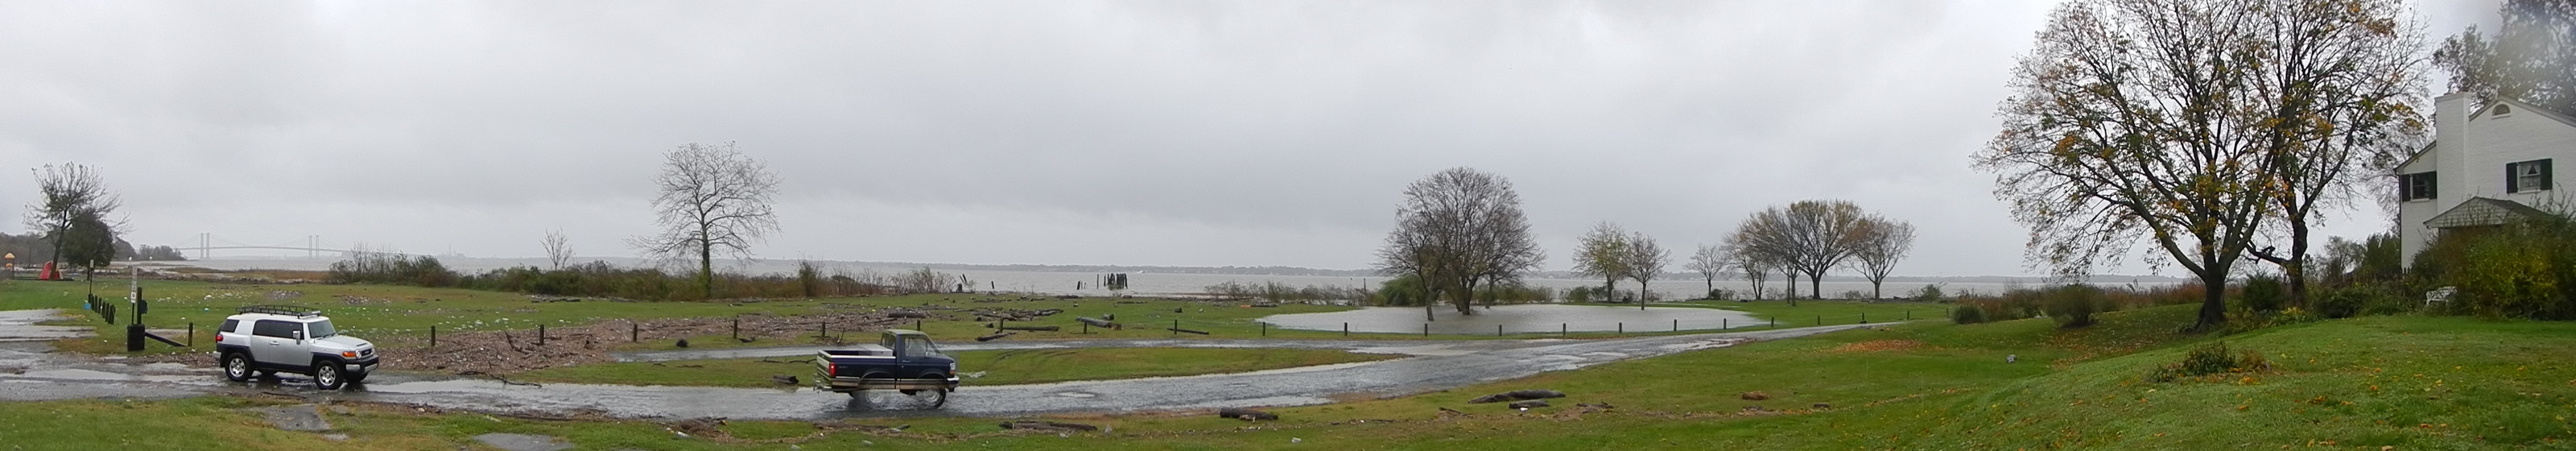 Bull Hill the morning after Hurricane Sandy. Note the debris including large logs. Picture courtesy Andrew Hayes | |
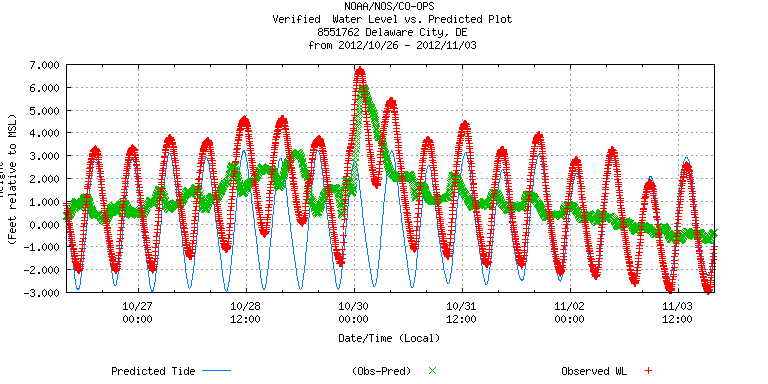
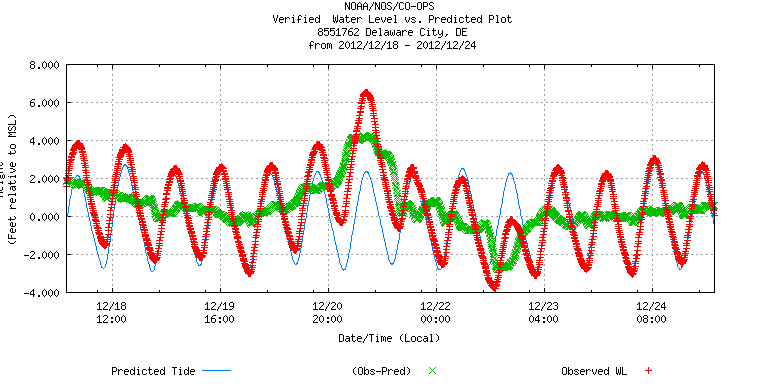
Water levels at the Delaware City tide station (shown above) rose to about 6.5 to 7 ft above MSL. Thomas Moran (Del. Div. Fish & Wildlife) reports that at the Bull Hill tide station, maximum elevations vs NGVD29 (0.88 ft above NADV88, the reference for the LIDAR map) were 8.06 ft, 10/30/12 2:04:59 AM (Hurricane Sandy), and 7.57 ft, 12/21/12 6:12:26 AM.
While interesting, the high tide information doesn't directly help us in understanding inundation without information about what areas become flooded by a given rise in water level. What does help is comparison of elevation maps with areas known to be flooded by observing debris lines or in pictures such as that above.
LIDAR Elevation Maps
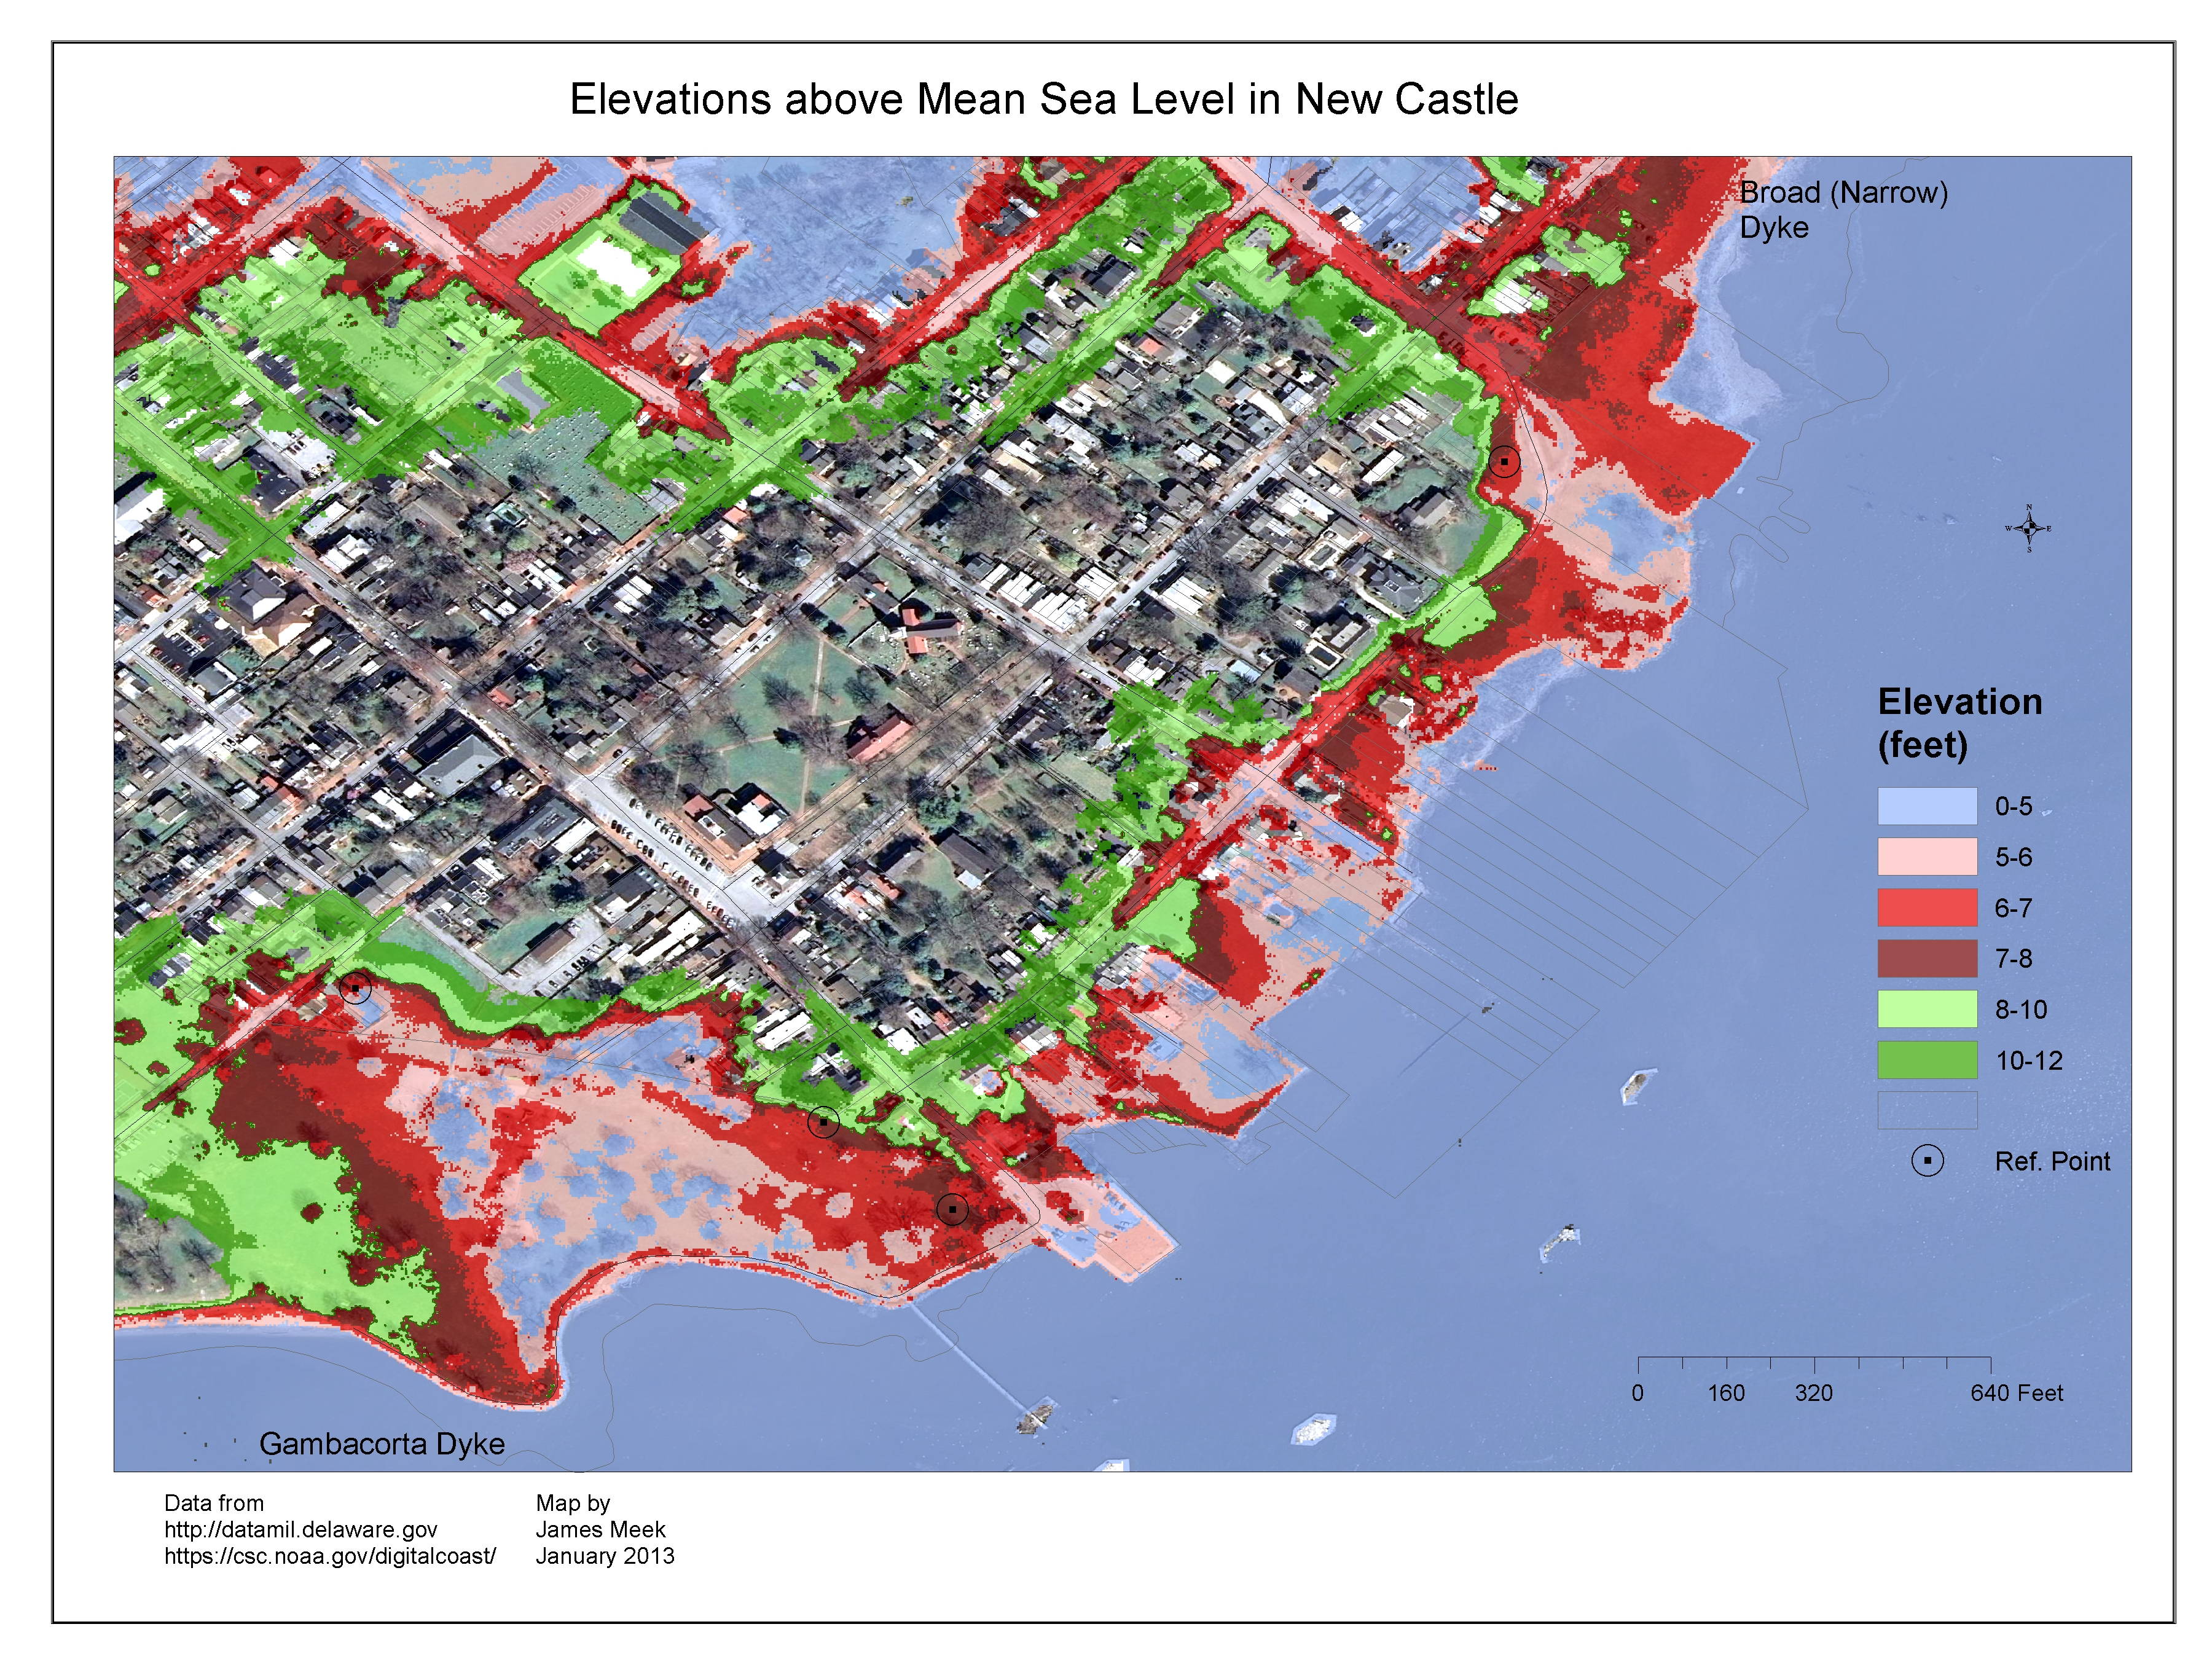
Elevations above Mean Sea Level in New Castle's downtown. Click on image to enlarge
LIDAR is a technique that allows gathering elevation information. Unlike radar which uses radio waves, LIDAR involves flying over an area, sending out laser beams and collecting backscatter information at 3 foot intervals. Elevation data are calculated and referred to mean sea level. I downloaded the data from NOAA's digitalcoast website. The resulting maps are of interest to us because they allow us to look at the elevations of areas that were flooded recently, and see what would be flooded in storms with water 1 or 2 or 3 foot higher than the recent ones. Water level is not the only factor relevant to what gets flooded in a storm (storm duration, wind driven wave action and surface topography also play roles), but it's the major one.
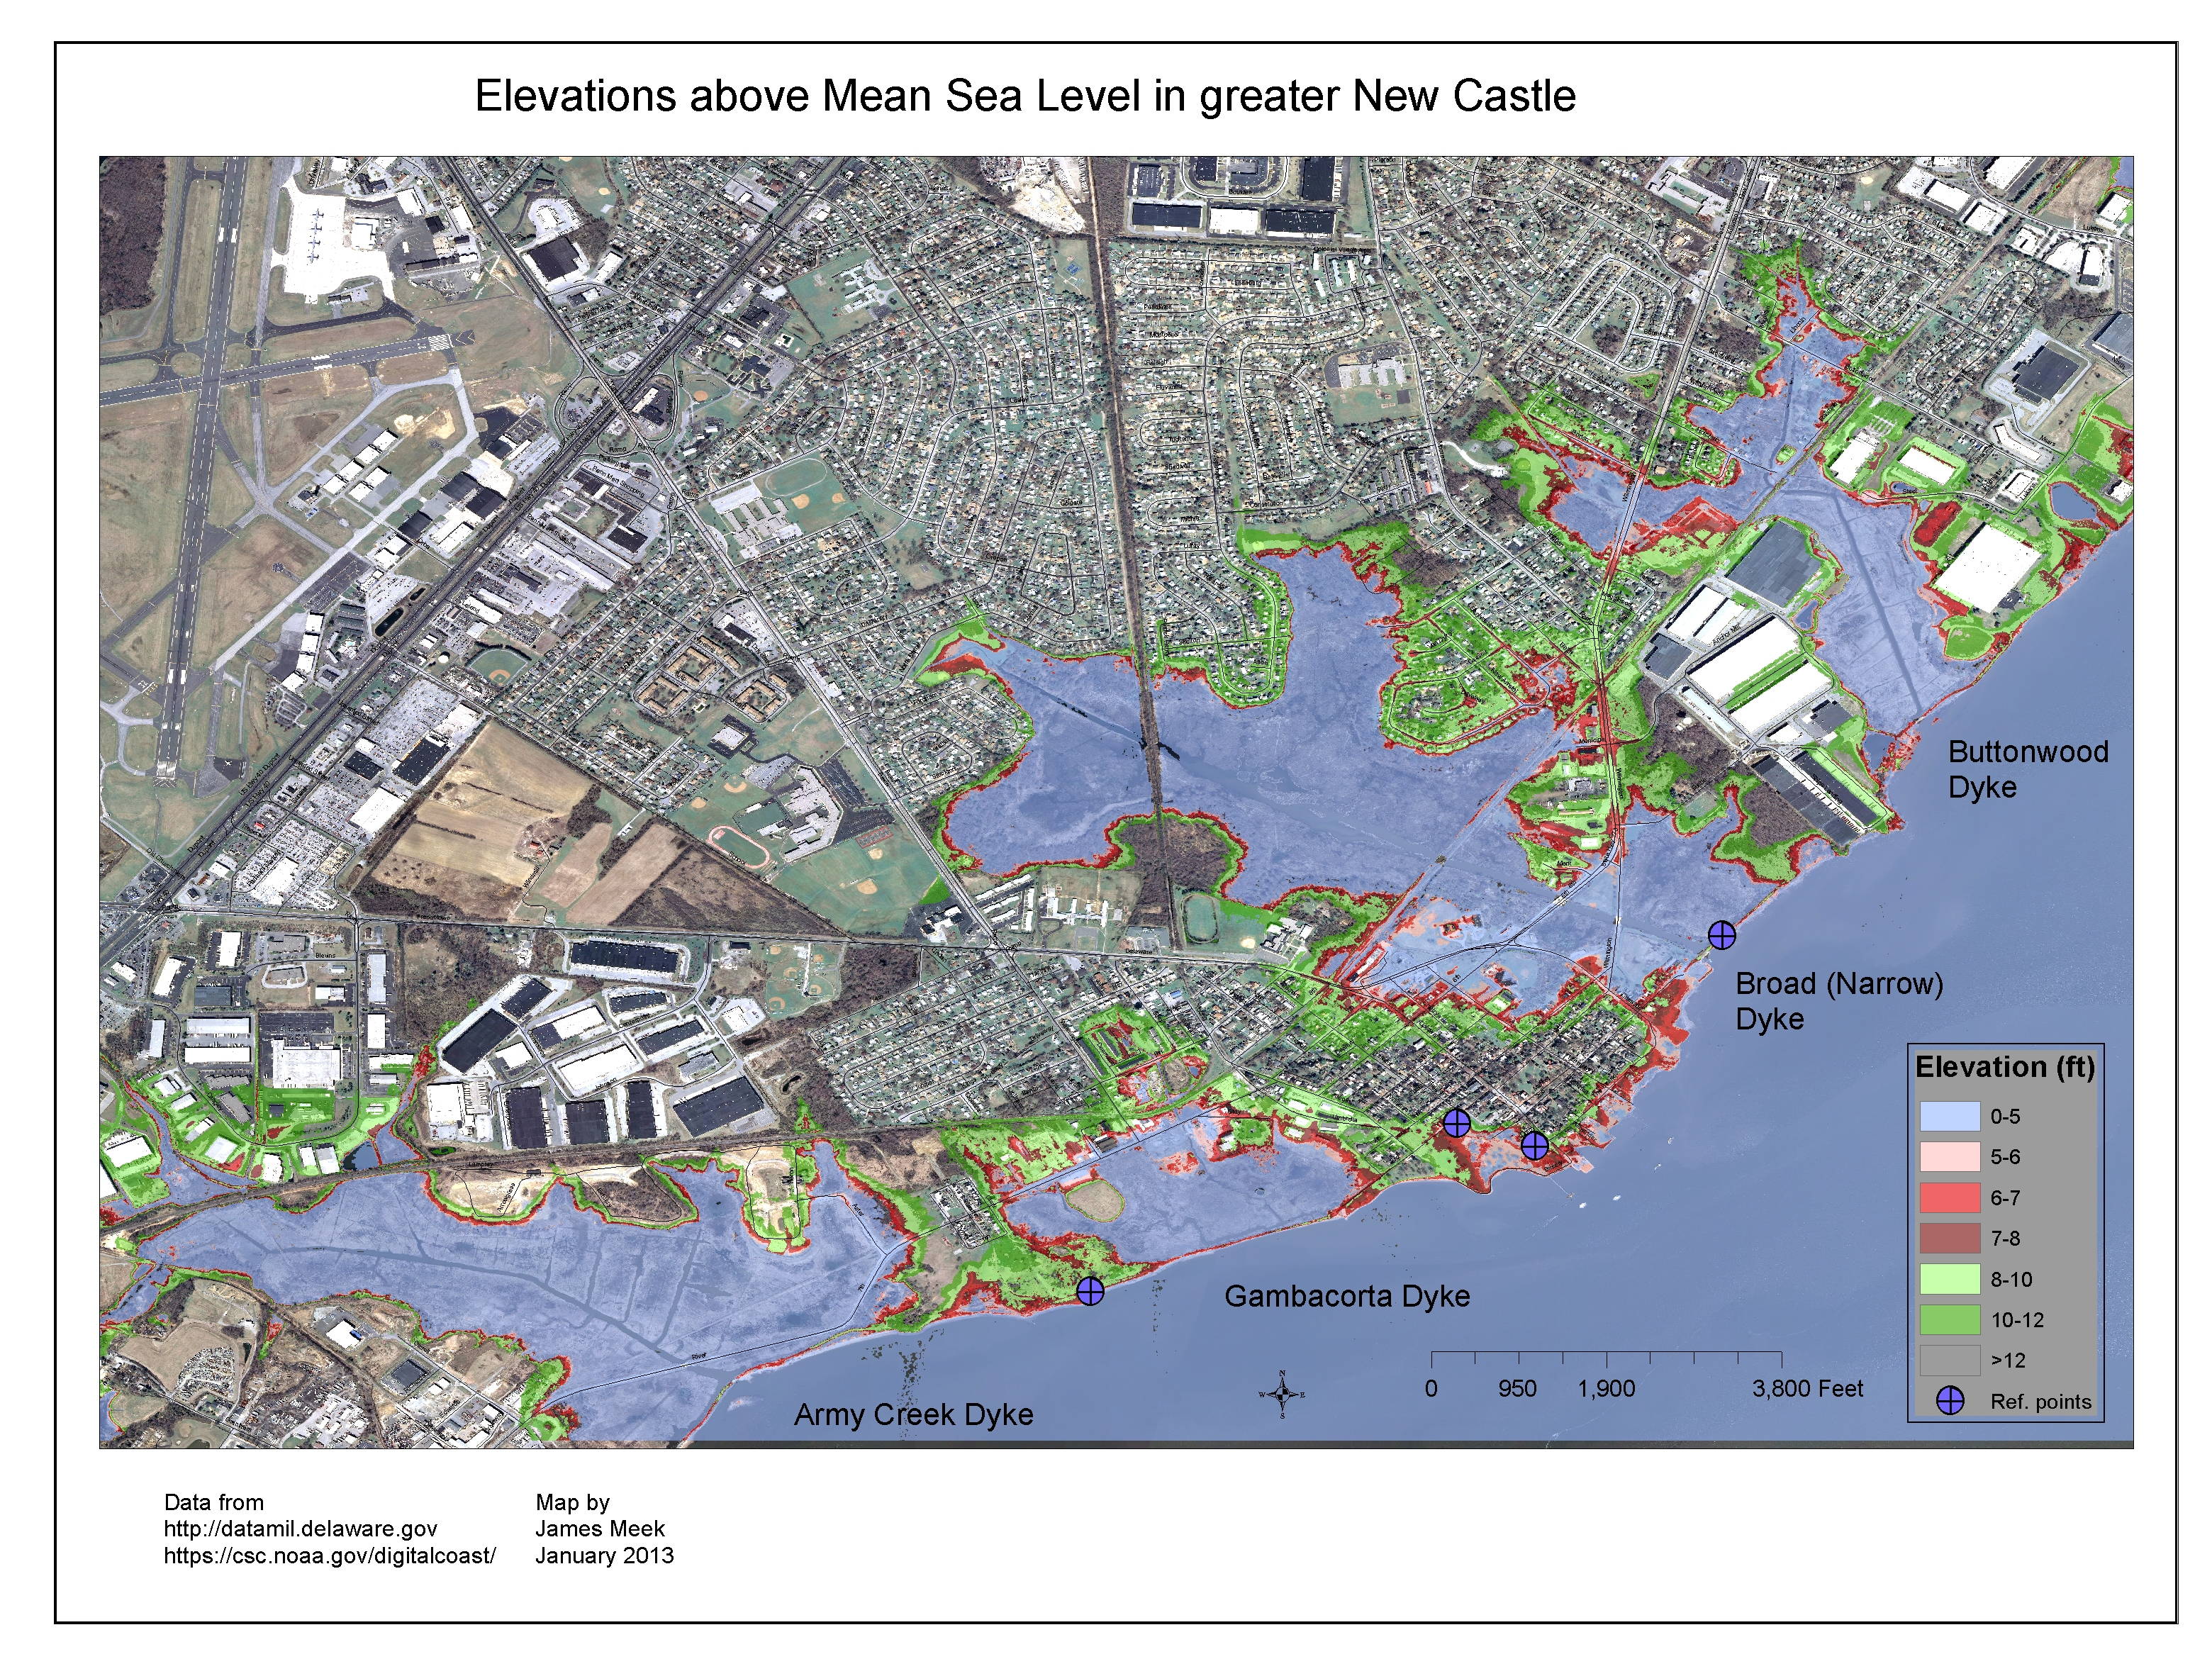
Elevations in greater New Castle
The map above and to the right show LIDAR elevations of 0-5 (blue), 5-6 (pink), 6-7 (red), 7-8 (dark red), and 8-10 feet above mean sea level in downtown New Castle. A pdf version that includes closeups of Bull Hill, the Strand, St. Peter Church area and W. 3rd st and Buttonwood is available. After the storms, debris remained in both the 5-6 feet and 6-7 foot elevations on the Broad (Narrow) dike, Bull Hill, Battery Park and Gambacorta dike near Dobbinsville (shown on the map as "reference points"). The storms therefore with their wind and wave additions reached about 6 feet above MSL.
Looking at the maps reveals:
A large area of town north of town, and north of the dike is less than 5 feet above MSL and is colored blue.
This area of marsh, roads, streets, the St. Peter Church area and the River Plaza shopping center is protected by the current dike, and would flood if it failed.
Chestnut street is between 6 and 8 feet above sea level. Andrew Hayes (P. E., professional land planner) stated: "I suspect a bit higher than 6 feet and the water would make a mad rush down Chestnut and start to flood the north end of town. Add some wind and wave action to the mix and things will go bad in a hurry."
Areas flooded at 7 feet above MSL in the historic area include: E. 4th between Harmony and Chestnut, Harmony between 4th and 6th, Delaware between 6th and 7th, E 2nd east of Chestnut, 43-58 W 3rd, E 6th and E 7th east of Delaware, the river side of The Strand and the "bank side" of the Strand from 42 (the George Read House) to 100 (the "King" house). At 8 ft, the basement entrance to the George Read House could be like the subway entrances in NYC during Hurricane Sandy.
In Buttonwood, flooded streets include Buttonwood Ave and Booker Cir.
Gambacorta dike protects some industrial areas west of town, but no houses, just a few lots in the Riverbend community.
The existing Broad (Narrow) dike protected the north side of town during the recent storms, although it was heavily damaged. As shown, it does not protect Bull Hill (E. 2nd street east of Chestnut), nor would it stop flooding up Chestnut, or on the Strand, or in areas adjacent to Battery Park such as Dalby Alley or E. 3rd st.
FEMA floodplain
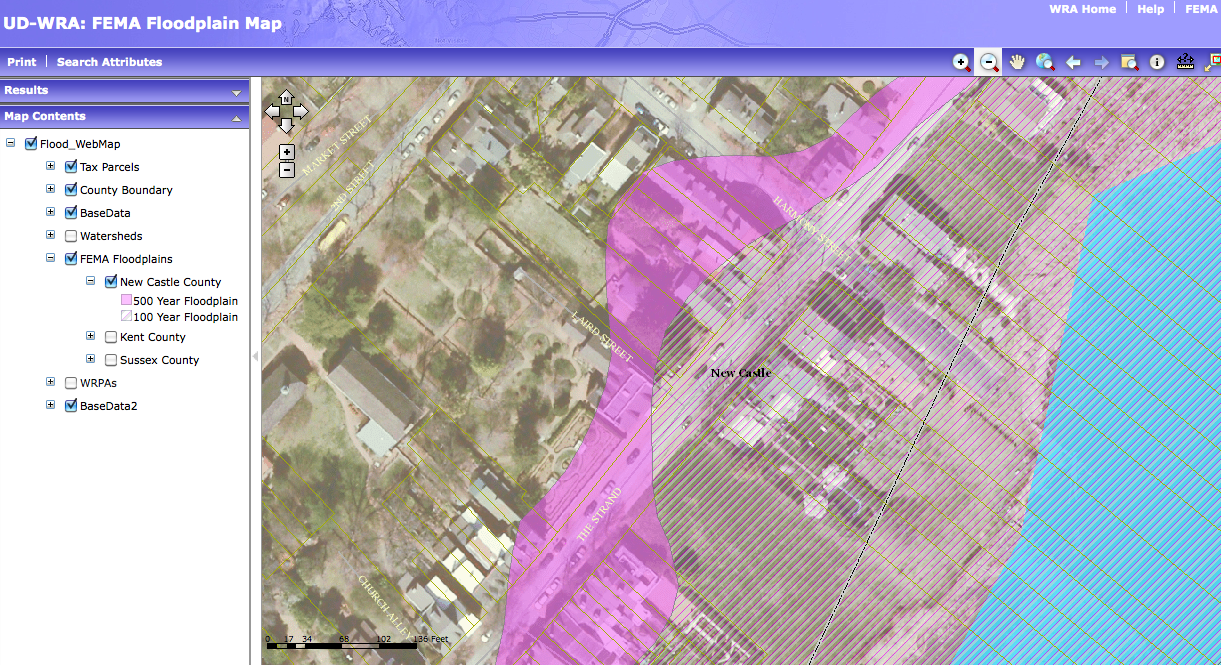 FEMA makes a variety of maps available including maps with 100 and 500 year flood zones. These are areas they state have a 1 or 0.2 percent chance of flooding in a given year. They are now being updated to reflect rising sea level and increasing chance of storms.
The one shown here is an "old" one (<2013). It shows that the 500 year flood plain would cover the
Read House and Immanuel Church parish house.
FEMA makes a variety of maps available including maps with 100 and 500 year flood zones. These are areas they state have a 1 or 0.2 percent chance of flooding in a given year. They are now being updated to reflect rising sea level and increasing chance of storms.
The one shown here is an "old" one (<2013). It shows that the 500 year flood plain would cover the
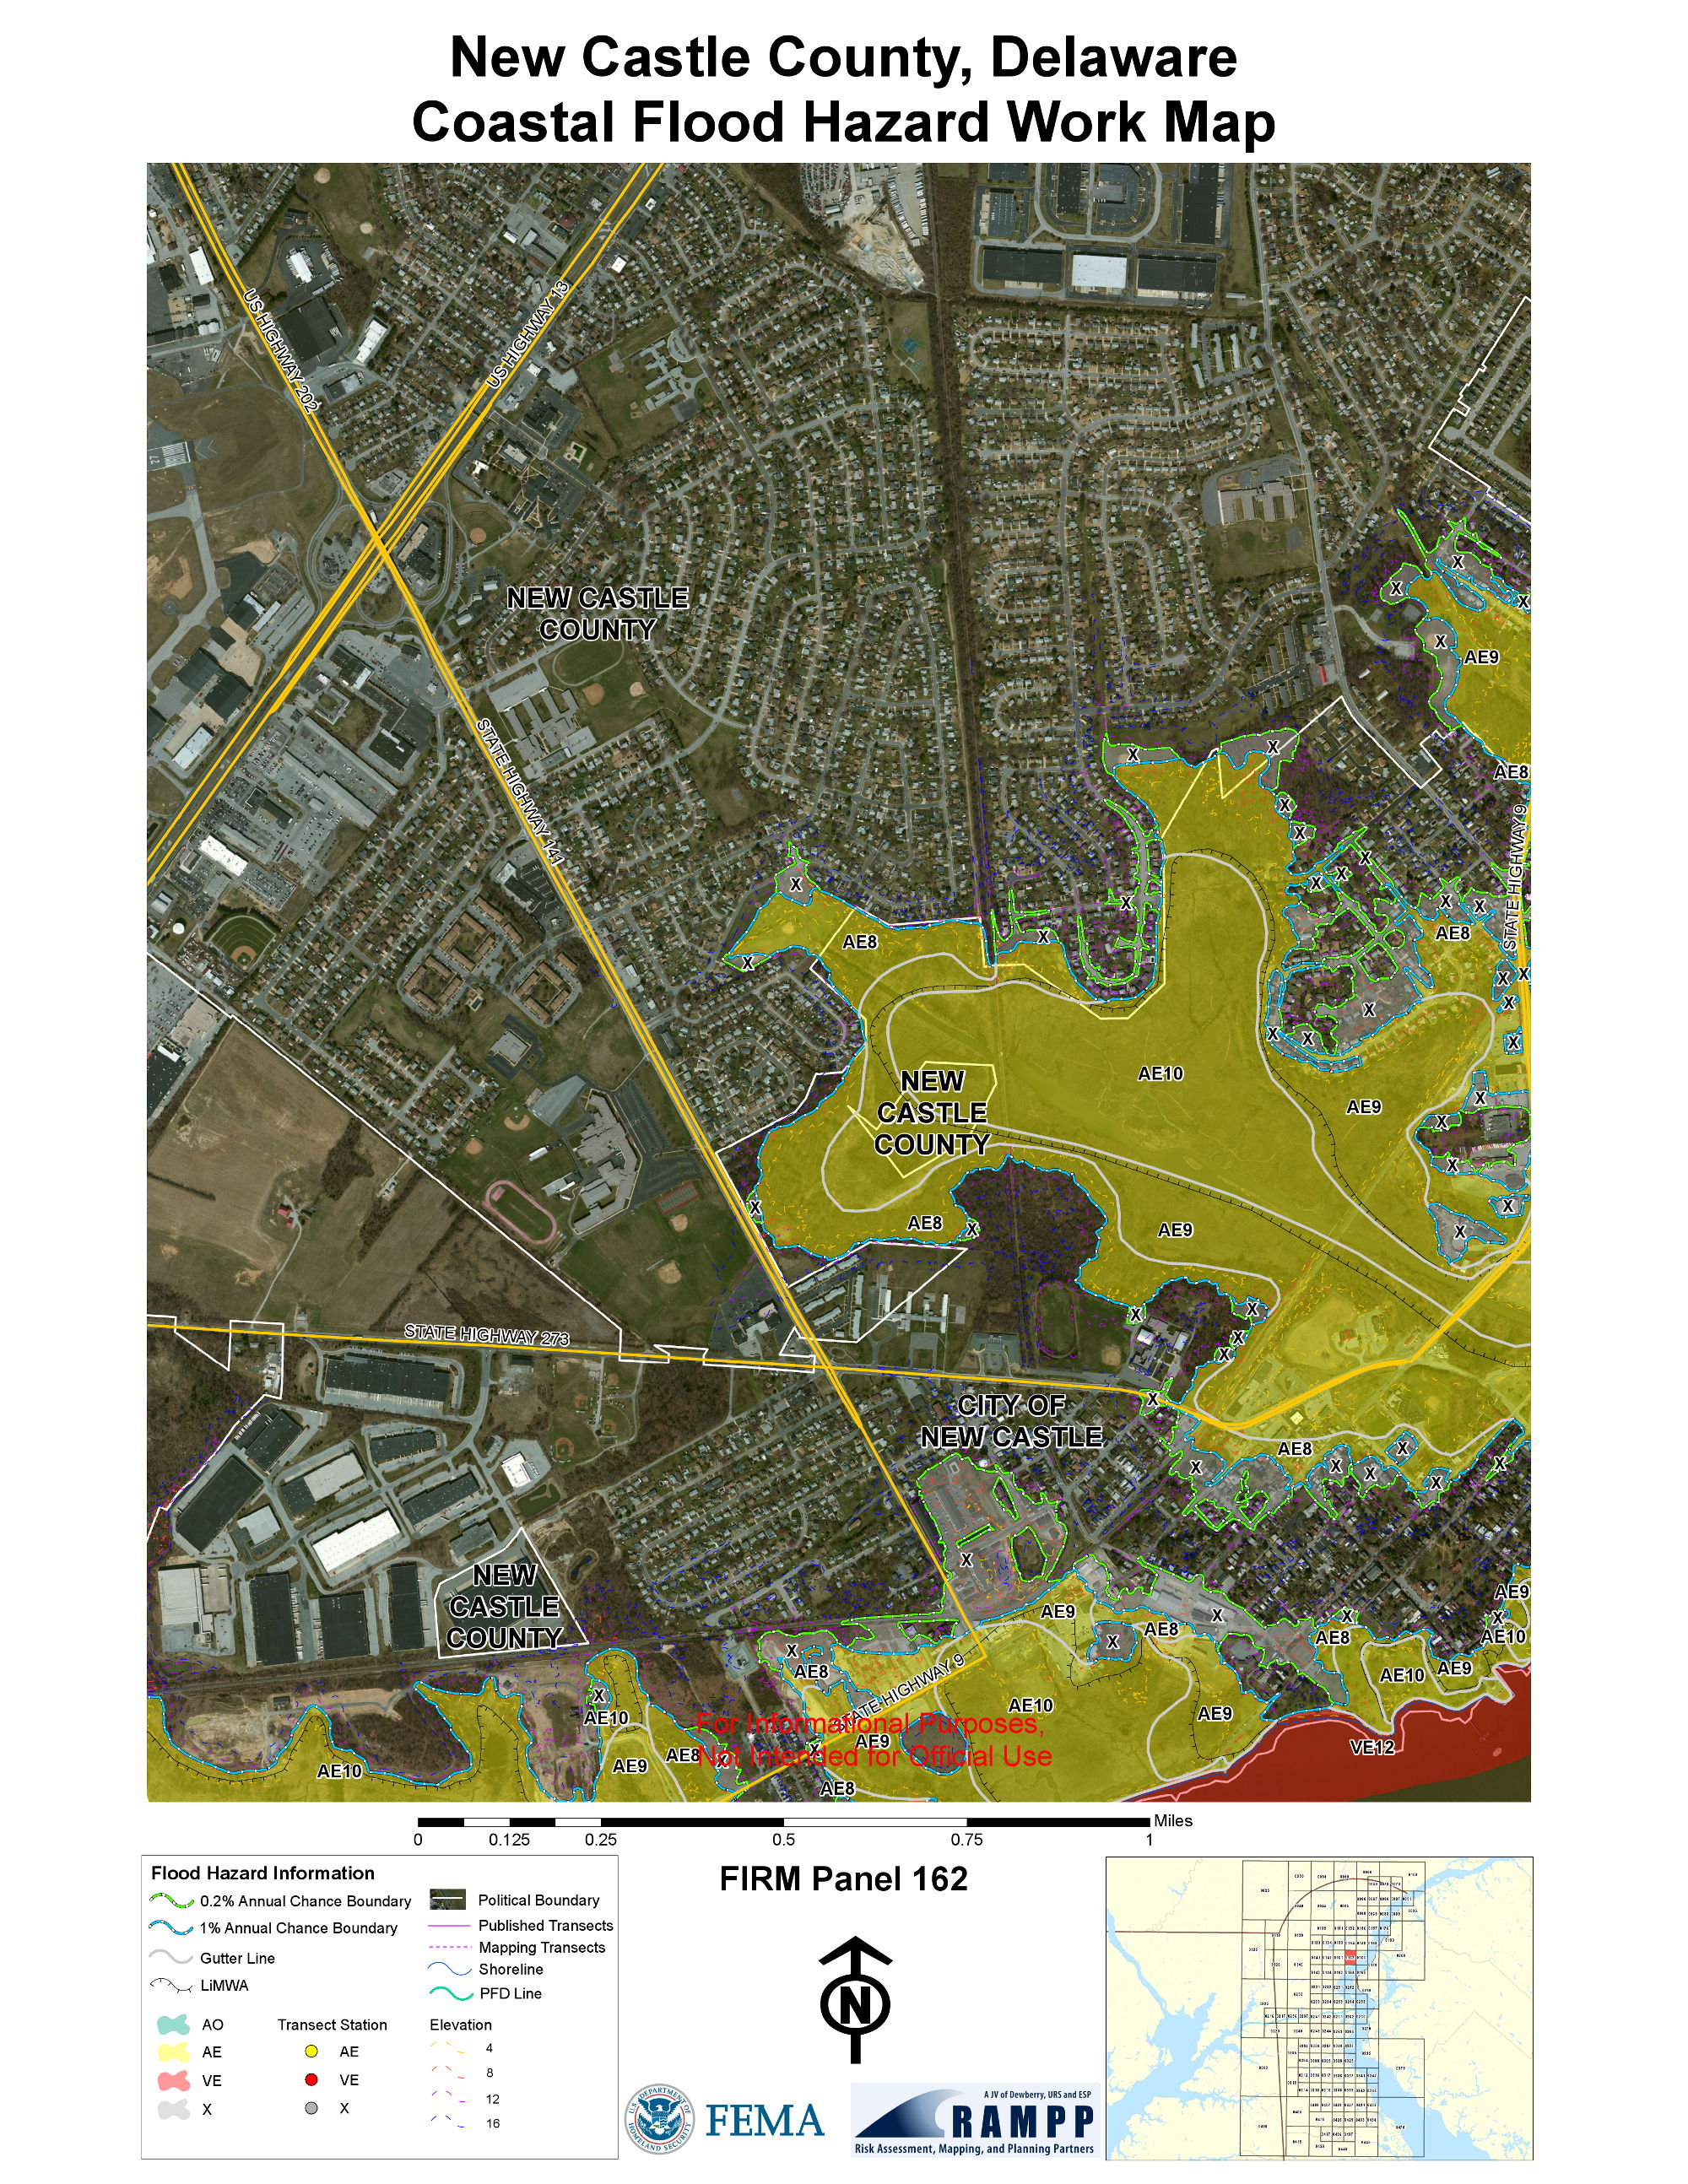
Read House and Immanuel Church parish house.  Draft versions of Panel 166 and
162 of the "new" (2013) maps of New Castle are now available.
The areas marked "AE## are 100 year flood zones of the indicated height above MSL (NADV88) and appear to be more extensive than in the previous flood zone maps. (See a list of
FEMA abbreviations acronyms).
Hundred year zones do not mean that floods only occur every 100 years, but it is of interest that in the great October storm of 1878, water "rose far as the residence of
John M. Clayton" (the Read House). Since that time the sea level
has risen 9 inches. Hundred year floods actually means that the chance of a flooding of an area is 1 percent/year. It is apparently based on
historical information not projections that include sea level rise and changes in storm intensity or frequency.
Projections for sea level rise vary 10 fold for the rise by the end
of the century,
(1 to 6 feet). The frequency and intensity of
North Atlantic tropical storms have risen markedly in the last 30 years.
Draft versions of Panel 166 and
162 of the "new" (2013) maps of New Castle are now available.
The areas marked "AE## are 100 year flood zones of the indicated height above MSL (NADV88) and appear to be more extensive than in the previous flood zone maps. (See a list of
FEMA abbreviations acronyms).
Hundred year zones do not mean that floods only occur every 100 years, but it is of interest that in the great October storm of 1878, water "rose far as the residence of
John M. Clayton" (the Read House). Since that time the sea level
has risen 9 inches. Hundred year floods actually means that the chance of a flooding of an area is 1 percent/year. It is apparently based on
historical information not projections that include sea level rise and changes in storm intensity or frequency.
Projections for sea level rise vary 10 fold for the rise by the end
of the century,
(1 to 6 feet). The frequency and intensity of
North Atlantic tropical storms have risen markedly in the last 30 years.
DNREC Sea Level Rise Inundation Maps
These interactive maps cover the entire state, and are referred to MHHW, which is 0.93 feet above MSL at Delaware City according to the NOAA. MHHW is also given as about 3 ft above MSL in the engineering report for the dike. Confusing!?! tide station data (8.657-7.727) Shown here are snippets including New Castle at the four available elevations. The highest one shown is 0.93 + 4.92 = 5.85 above MSL, which is a little above the height of recent storms and 2 feet below the planned dike level. Note that the area north of town which is protected by the exiting dike is shown flooded at 4.92 feet. The maps have a google-like interface and are easy to use at the four fixed elevations. This map is constructed from LIDAR data. Similar but more extensive maps are available for New Jersey, which also include economic impact, vulnerability, facilities and FEMA maps and explanatory material. These maps are also referenced to MHHW, perhaps since Sea Level Rise (SLR) ties in more directly to it.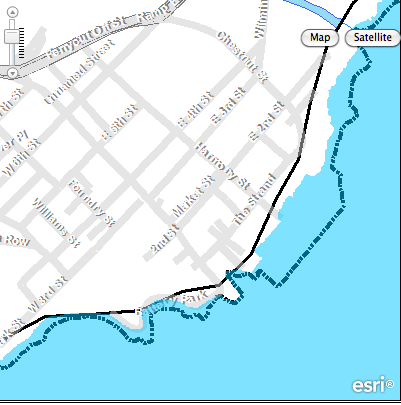 MHHW ( above MSL) | 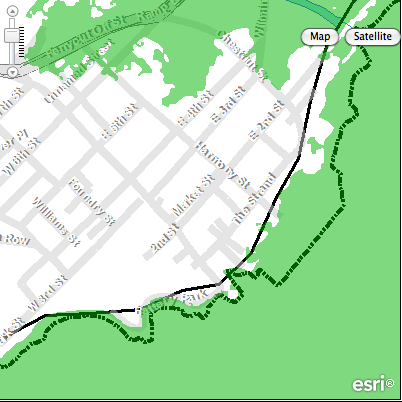 0.5m (1.64 ft) above MHHW | 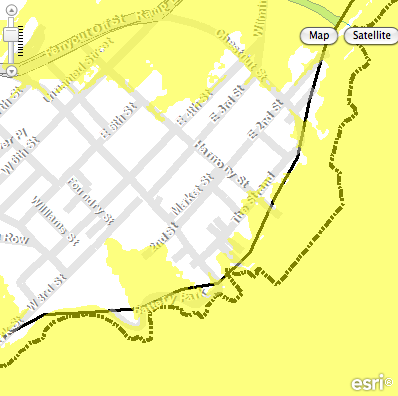 1.0m (3.28 ft) above MHHW | 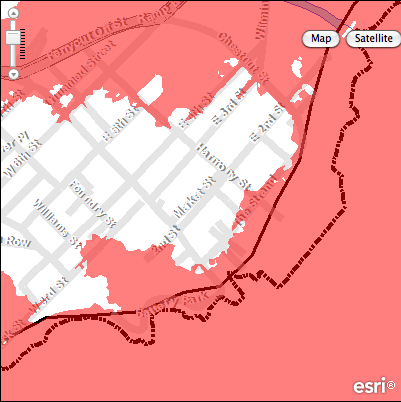 1.5m (4.92 ft) above MHHW |
Existing and planned dike profiles
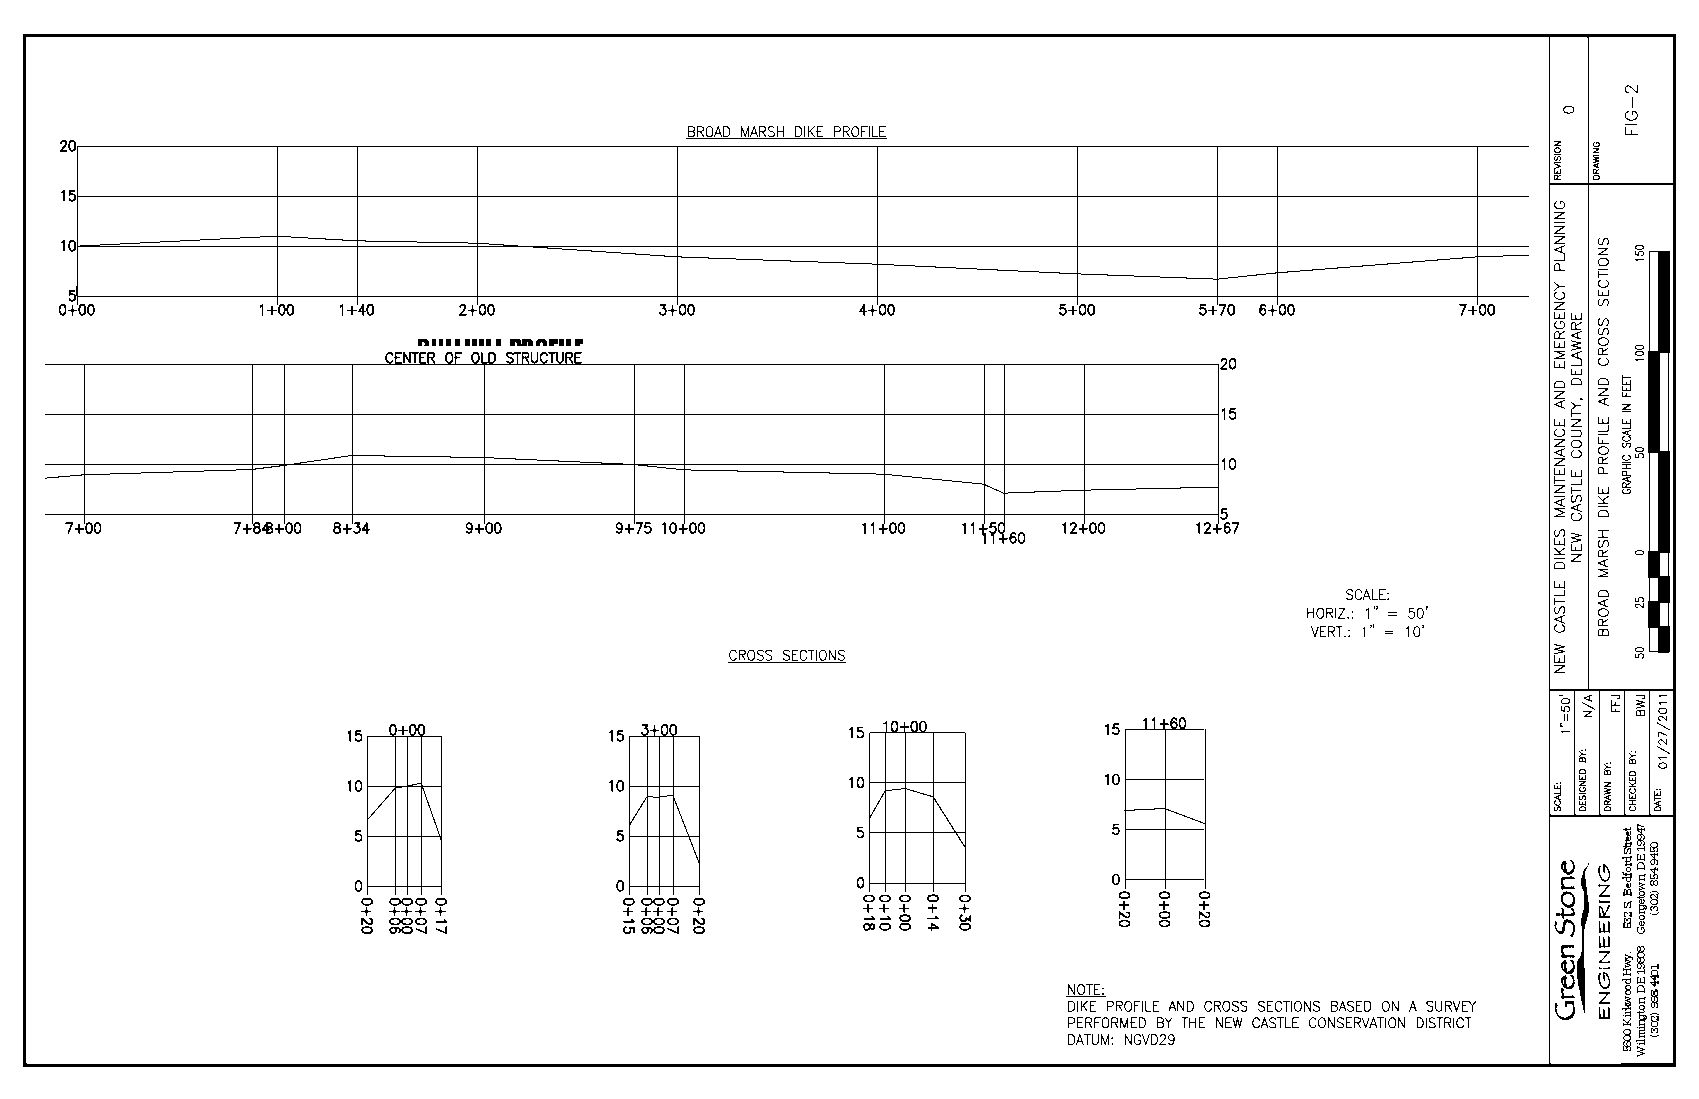 In 2011, a dike profile
was prepared by Greenstone Engineering
(Appendix A) based on a survey by DNREC's Coastal Conservation District
using NGVD29 as a datum. According to NOAA's online datum converter
at longitude -75.56, latitude=39.658 (New Castle), NGVD29 is about 0.88 ft. above NAVD88, so one can mentally subtract 1 foot from
the elevations in the profile for comparison with the LIDAR data.
In 2011, a dike profile
was prepared by Greenstone Engineering
(Appendix A) based on a survey by DNREC's Coastal Conservation District
using NGVD29 as a datum. According to NOAA's online datum converter
at longitude -75.56, latitude=39.658 (New Castle), NGVD29 is about 0.88 ft. above NAVD88, so one can mentally subtract 1 foot from
the elevations in the profile for comparison with the LIDAR data. 
The dike's elevation at that time ranged from about 6 to 11 feet; the FEMA 100 year flood elevation was 9 ft (vs NGVD29). The map to the right shows the 100 and 500 year flood zones based on 9 and 11 feet elevations.
 In August 2012, (before the storms)
a New Castle Dike Design Presentation
made recommendations including:
In August 2012, (before the storms)
a New Castle Dike Design Presentation
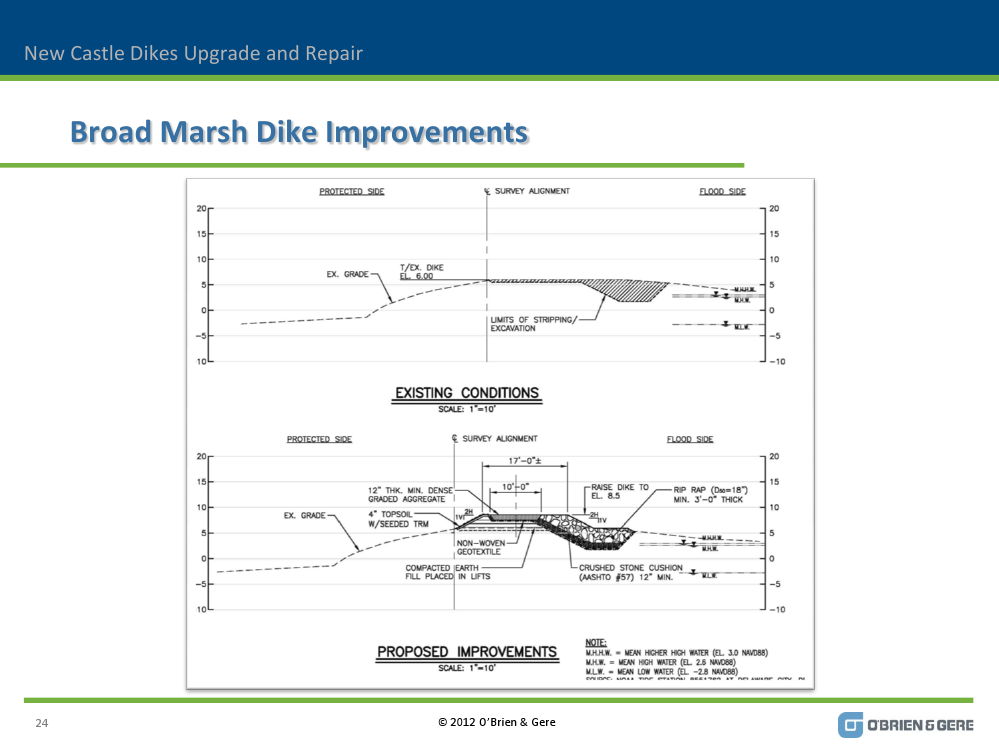
made recommendations including: * Raise Dikes to Elevation 8.5 Feet NAVD 88 (current low= 5.2 feet)
* Extend Dikes to Tie-Out as Required.
The profile of the proposed improvements vs exisiting conditions shows similar width (17ft at the top) with a flood-side layer of rip rap down to MSL. Rip rap is a sloping layer of loosely packed rock used to reduce the scouring and undermining that occurs at vertical structures like bridge piers and seawalls. The area between MSL and MLW would allow some vegetation to occur.
As an aside, using the name "Broad Dike" to refer to the dike at the end of E 2nd street is historically incorrect, and was apparently given by a former
DNREC employee who grew up in the area and recalled it from his childhood. The bridge commonly known as Broad dike is the one with historic marker on it. It is shown on the most recent DELDOT bridge index as bridge 289, Wilmington Road, Broad Dyke. It was also called the Broad Dyke on a 1932 Delaware Public Archives map of "New Castle as William Penn Saw It", the 1805 Latrobe survey, and the official town survey in 1797. The dike on E 2nd street renamed Broad Dike was variously called the foot dike or narrow dike. Official misnaming of areas on maps is not unheard of. USGS navigation charts for many years (and may still) show "Deemers Beach" as adjacent to Dobbinsville. The actual location was further south between the range light and current Print Pack (formerly Delaware Rayon) plant.
Jim Meek '13
NC-CHAP,
New Castle Historical Society
NC-CHAP,
New Castle Historical Society